12/21/24 11:10 PM


DNA Medical Software
Software Systems for
Medical Practices


Graphing

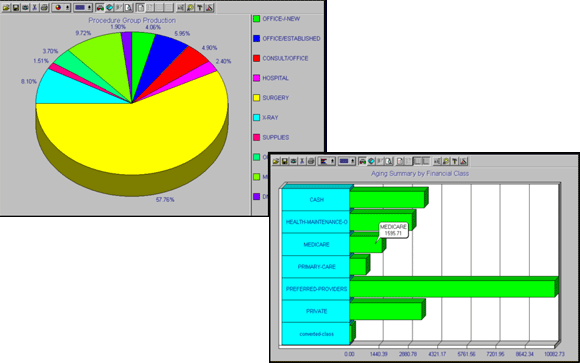
The graphs shown below are created directly on the DNA system and can be copied to a word processor or printed to a color or standard laser printer. The first graph shows physician production by procedure class. The procedures classes are user defined for complete flexibility. The charts can be produced in either a Month-to Date or Year-to- Date basis.

The graph on the right shows current A/R by account Financial Class. Again, the financial classes are user defined.


Why Computerize
| Why DNA | Features | Screen caps | Graphing | Reporting | Imaging | Telephony
Testimonials | Contact
 | Home page

All materials © 2001-2024 DNA Medical Software
18 Technology#126 Irvine, CA 92618
Ph: 949.450.1230  Fax: 949.450.1242

2109 S. Wadsworth Blvd. Suite 303 Lakewood, CO 80227
Ph: 888.DNA.5550  Fax: 800.878.8674

4193 Brockton Avenue Riverside, CA 92501
Ph: 877.469-5850  Fax: 877.349.8369